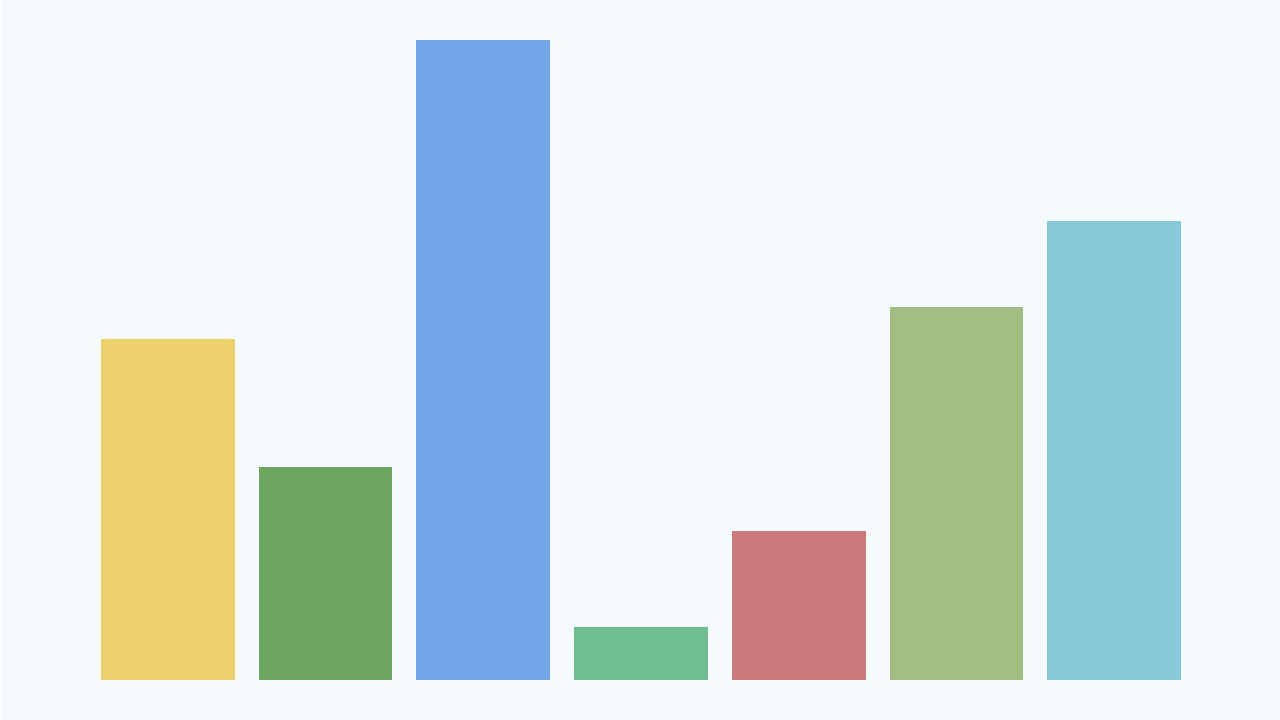
Bar Chart I
Prompt
Are you passionate about data visualization? Your challenge is to craft a Bar Chart using React.
The question's aim is to develop a bar chart component in React. This component will efficiently display a vertical bar chart derived from a structured array of data. Each element in this array will transform into a distinct bar in the chart, with its height proportional to the ticket count associated with each department.
What makes this bar chart stand out is its use of color. Each bar will be uniquely colored based on a predefined color code.
You can use the api.js file in the server folder to retrieve the mock data for rendering your bar chart. This data also includes colour information.
Example
Playground (Prompt 1)
You can use the getData function to fetch the chart data. This function returns a promise which resolves with the chartData. Remember to handle this promise correctly, typically using .then() method or async-await syntax.
To determine the maximum height among all the bars in your chart, consider using the Math.max function combined with the .map method. For example, you can calculate the maximum height like this
const maxHeight = Math.max(
  ...items.map((item) => item.ticketCount)
);The reason for calculating the maximum bar height (maxHeight) is to use it as a reference for scaling the height of all other bars. By knowing the maximum height, you can proportionally calculate the height of each bar relative to this maximum, ensuring that all bar heights are accurately represented in your chart.
Solution (Prompt 1)
Explanation
Hello friend! Let's break down this solution. In an interview, the goal isn't just to render rectangles, but to show how you manage state and handle data cleanly. Let's look at the key concepts.
1. Robust State Management
In App.js, instead of using booleans like isLoading and isError, we use a single status string:
const [status, setStatus] = React.useState('idle');This is a "finite state machine" pattern. Our app can only ever be in one state: 'idle', 'loading', 'success', or 'error'. This prevents impossible bugs (like being in a loading and error state at the same time) and shows the interviewer you build reliable UIs.
2. The Math Behind the Bars
How do we calculate the height of each bar so they don't break out of the container? First, we find the highest ticket count using Math.max:
const maxHeight = Math.max(
  ...items.map((item) => item.ticketCount)
);
Once we have that maximum, we calculate a percentage for each bar: (current ticket count / maximum ticket count) * 100.
If our max is 60, that bar is 100% height. A bar with 30 tickets becomes 50% height. This little bit of math guarantees that no matter what data the API sends, our chart perfectly fits!
3. CSS Flexbox Magic
To make the bars sit side-by-side and grow from the bottom, we lean on CSS Flexbox.
We set our .chart container to display: flex. To force the bars to anchor to the floor, we use align-items: flex-end. Finally, simply applying flex: 1 to the bars tells the browser to divide the horizontal space equally among them.
When you explain these simple but powerful choices, your interviewer will see a mature engineer who understands their tools. You've got this!
Common Pitfalls
- Fetching the Data: The
getDatafunction is returning a new Promise which gets resolved after 100 milliseconds with the data array. If the engineer isn't familiar with how Promises work or how they are used to manage asynchronous operations in JavaScript, this might be confusing. - Calculating Bar Height: You need to calculate the height relative to maxHeight. For example, if the height is 80 and the maxHeight is 200, the
getHeightfunction takes two parameters:heightandmaxHeight. It calculates (80 / 200) * 100, which equals 40%. Therefore, the function returns the string "40%". - Styling Bar Chart: If you are giving the height of a bar in percentages, which is most likely to be the case, then the parent container of a bar needs to have some fixed height for the bar to appear.
My Attempt (Prompt 1)
Interviewer Criteria
HTML/CSS
Does my layout accurately match the provided image?
Did you style the UI quickly (10 minutes or less)?
Did I consider using the
namenode from chart data for improving accessbility?Are my CSS class names both self-explanatory and meaningful?
JavaScript
Was I successful in demonstrating my ability to fetch data from a mock API?
Was I able to sort the chart items in both ascending and descending order cleanly?
Do I know how the JavaScript
sortmethod works?Have I leveraged ES6 features efficiently, such as let, const, arrow functions, and destructuring?
Are my variable and function names descriptive, maintaining a consistent naming convention?
How swiftly was I able to develop the logic for identifying the bar with maximum height without significant obstacles or delays?
Was I able to cleanly calculate the height of bars relative to the one with maximum height?
React
Have I used the key prop appropriately on all iterated elements, ensuring efficient and correct re-rendering?
Have I considered handling the
loadinganderrorstate when fetching the data?Did I lift the state appropriately, such as lifting the
modestate to theAppto calculate the sorted chart items?Did I derive the sorted chart items from chart items, instead of creating another state for storing sorted chart items?
Am I comfortable using React hooks?
Am I comfortable and proficient in using function components?
Component Architecture
Did I create separate components for
<BarChart />,<Bar />, and<Controls />?Are the names of my classes, functions, handlers, and components clear and understandable?
Performance
Am I able to discuss how to accommodate many data points without compromising the visual integrity and performance of the chart?
Time Checkpoints
- 10:00 AM
Interview starts 👥
- 10:03 AM
Prompt given by the interviewer
- 10:05 AM
Candidate reads the prompt, asks clarifying questions, and starts coding
- 10:10 AM
Data fetched from mock server and stored in state
- 10:20 AM
Chart rendered
- 10:30 AM
Styling completed
- 10:35 AM
Sorting logic implemented
- 10:50 AM
Support for data of any shape added
- 10:55 AM
Discussion with interviewer
- 11:00 AM
Interview ends ✅