Bar Chart I
Prompt
Are you passionate about data visualization? Your challenge is to craft a Bar Chart using React.
The question's aim is to develop a bar chart component in React. This component will efficiently display a vertical bar chart derived from a structured array of data. Each element in this array will transform into a distinct bar in the chart, with its height proportional to the ticket count associated with each department.
What makes this bar chart stand out is its use of color. Each bar will be uniquely colored based on a predefined color code.
You can use the api.js file in the server folder to retrieve the mock data for rendering your bar chart. This data also includes color information.
Example
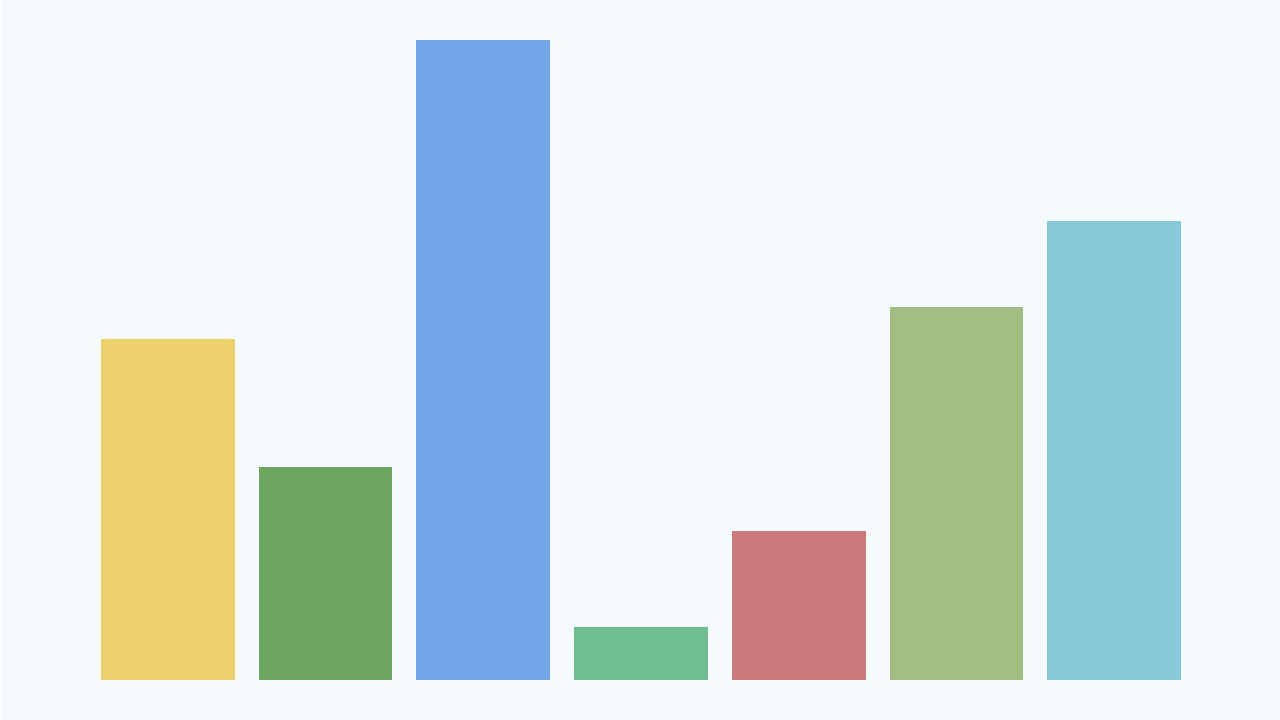
Playground (Prompt 1)
You can use the getData function to fetch the chart data. This function returns a promise which resolves with the chartData. Remember to handle this promise correctly, typically using .then() method or async-await syntax.
To determine the maximum height among all the bars in your chart, consider using the Math.max function combined with the .map method. For example, you can calculate the maximum height like this
const maxHeight = Math.max( ...items.map((item) => item.ticketCount));The reason for calculating the maximum bar height (maxHeight) is to use it as a reference for scaling the height of all other bars. By knowing the maximum height, you can proportionally calculate the height of each bar relative to this maximum, ensuring that all bar heights are accurately represented in your chart.
Solution (Prompt 1)
Explanation
I will walk you through an actual interview challenge asked at Atlassian. We will go through the solution step by step. During this process, I will show you what an ideal solution looks like, where candidates go wrong and how interviewers judge your solution and decide if you are "Strong No", "No", "Yes" or "Strong Yes". Getting "Strong Yes" gives you more negotiation power.
Now before we start coding, it is very important to thoroughly read the prompt and understand the requirements. If anything is not clear, we should discuss it with the interviewer. It is very common for candidates to jump straight into coding because of pressure and nervousness and later realise they coded something which was not expected and in the interview environment the time is so limited, it becomes very tough to go back, which makes us feel even more nervous.
Now, let's start solving.
In the starter code we can see we are given a mock API which gives us the data to render bar charts, we can fetch the data by calling the getData function, the getData returns a promise which resolves to chartData after 500ms.
Mock APIs in Interviews
Companies usually don't create APIs for interview purposes, instead they give a function similar to getData which acts like a mock API. Some candidates who are new to coding sometimes get confused because they know that data needs to be fetched from an API and there is no URL available.
We will start by creating a state called chartData in App.js which will hold our fetched data. We will initially return null in our App because we haven't built our UI yet, we will add it in the next steps.
App.js
import React from 'react';import './styles.css';export default function App() { const [chartData, setChartData] = React.useState([]); return null;}Now, we will fetch the data inside useEffect using our mock API. We will import the getData function and call it inside our useEffect, getData will return a promise so we will use the .then method to get the result once the promise is fulfilled. We will pass an empty array as a second argument to useEffect to make sure our effect only runs once on the first load of the page. Now that we have data we will use the setChartData updater function to update the chartData state with fetched data.
App.js
import React from 'react';import './styles.css';import { getData } from './server/api';export default function App() { const [chartData, setChartData] = React.useState([]); React.useEffect(() => { getData() .then((data) => { setChartData(data); }) .catch(() => { // handle errors }); }, []); return null;}Now, our chartData state has the data which we fetched from getData mock API, we will now create a component called BarChart and pass this chartData state to the BarChart component as a prop. The BarChart component will be responsible for rendering the chart using this data.
But, before we create our BarChart component and render our chart I would like to discuss a common mistake which candidates usually make.
Common Pitfalls
- A lot of candidates get confused in imports, for example our
getDatafunction is a named export, so to import it we need to use curly brackets. Candidates import it asimport getData from './server/api'without curly brackets (as a default import), and then they see errors on screen. So it is always good to check if it is a default export or a named export. - A lot of candidates do not initialise state with an empty array, they keep it like
React.useState(), which again throws an error when you try to map over this state later on. So if you know that your state will hold an array of objects and you are supposed to loop over it to generate a piece of UI, it is always good to initialise it with an empty array.
Interview Tip
I highly recommend candidates to use console.log during interviews. When we fetch the data we should always use console.log() to check if everything looks good and we are storing the data in state correctly. A lot of the time what happens is, the data does not get set as expected in the state, later on it causes issues and the candidate does not understand where they went wrong. So it is better to keep checking if everything is working fine step by step during interviews. Don't try to write all the code and test everything at once, it will become tough and time consuming to identify where you made a mistake.
Now, we will create a new folder called components in which we will create a component file called BarChart.js. This component will accept a prop called items and render the chart using those items. We will also update our App.js to import and render the BarChart component, passing chartData as the items prop.
App.js
import React from 'react';import './styles.css';import { getData } from './server/api';import BarChart from './components/BarChart';export default function App() { const [chartData, setChartData] = React.useState([]); React.useEffect(() => { getData() .then((data) => { setChartData(data); }) .catch(() => { // handle errors }); }, []); return ( <main className="wrapper"> <BarChart items={chartData} /> </main> );}components/BarChart.js
import React from 'react';function Bar({ ...delegated }) { return <div className="bar" {...delegated} />;}export default function BarChart({ items }) { return ( <div className="chart"> {items.map((item) => ( <Bar key={item.id} style={{ background: item.colour, }} title={item.name} /> ))} </div> );}Our BarChart component is a reusable component, its purpose is to accept items as a prop and render the bar chart. Let's see how it works at this moment.
We will create a container div to which we will give the class name of chart, this will be responsible for holding all our bars.
Now, inside this container div we will render each individual bar by using the map method of JavaScript. Giving the key prop is very important here, some candidates forget to add the key prop.
{ items.map((item) => <Bar key={item.id} />);}Each individual bar is a div, however I have separated it into a separate component called Bar. Some might argue making it a component is overkill, but we need to think in terms of reusability and maintainability. Going forward a couple of features could be added to a single bar as well, so I have created it as a separate component. If it grows in features I will move it to its own separate file.
We will give style using inline styling, the background of each bar will be the colour of each item in our array of objects. The reason we are using inline styles is otherwise we will have to create classes for each individual color in our CSS and we don't know what the colors might be because the data is coming from the backend.
{ items.map((item) => ( <Bar key={item.id} style={{ background: item.colour, }} /> ));}Now, for improving accessibility you could pass the title attribute to the div. It is a good to have thing, not very important. When you pass item.name as title, if you hover over each bar, it will show the name of that bar.
I would like to discuss two common mistakes which candidates make when it comes to component architecture:
Common Pitfalls
- They do not create a separate component like
BarChart, they write the whole logic inApp.js. There are two reasons why they do so:- They feel that if they create a separate component like
BarChart, it will take a lot more time to finish the solution so they end up writing all logic inApp.js, in the hope that they will separate it out later on once functionality is working end to end, but it never happens in most of the cases. I always recommend breaking it down as early as you can, you might never get time later on. - They don't think in terms of reusability and separation of concerns, they end up writing everything in a single file, they just don't feel the responsibility of breaking it down.
- They feel that if they create a separate component like
- Some candidates do create a separate component like
BarChart, but they end up making the API call insideBarChart, which makes ourBarChartless reusable and coupled with API fetching logic which is incorrect. To keep theBarChartas a reusable component, the only responsibility ofBarChartneeds to be to takeitemsas a prop and render the chart. TheBarChartshould not be worried about where the items are coming from, that should be the responsibility of the parent component, which in our case isApp.js. IfBarChartaccepts data in a different format than what is being returned from API, it is the responsibility of the parent component ofBarChartto transform that data according to the expectations ofBarChartand pass it as props.
Calculating Height of Each Individual Bar
import React from 'react';const getBarHeight = (height, maxHeight) => `${(height / maxHeight) * 100}%`;function Bar({ ...delegated }) { return <div className="bar" {...delegated} />;}export default function BarChart({ items }) { const maxHeight = Math.max( ...items.map((item) => item.ticketCount) ); return ( <div className="chart"> {items.map((item) => ( <Bar key={item.id} style={{ background: item.colour, height: getBarHeight( item.ticketCount, maxHeight ), }} title={item.name} /> ))} </div> );}Now, let's talk about the calculation of height of bars. We need to calculate the height of each bar relative to the height of the bar which has the maximum height, otherwise the bar might flow out of the container. We can use Math.max to achieve this, here is the logic:
const maxHeight = Math.max( ...items.map((item) => item.ticketCount));Now that we have the maximum height, we calculate a percentage for each bar using the following formula:
(current ticket count / maximum ticket count) * 100
If our max is 60, that bar will have a height of 100%. A bar with a 30 ticket count becomes half of that which is 50% height. This mathematical calculation ensures irrespective of what value we get in items prop, our bar always fits perfectly and does not overflow.
We have created a utility function called getBarHeight to do this calculation for us. If any JavaScript logic is not dependent on state and you feel it could be reused later on, we should always create a utility function for it and move it to the utils folder. In our case I have kept it within the BarChart component because we are not using it anywhere else. These are the little things which separate a junior engineer from a senior engineer and a "Yes" from a "Strong Yes" during an interview.
Styling the Bar Chart
Now, let's talk about styling our bar chart. We need to make sure our styling looks good, it should look close to the example.
*,*::before,*::after { box-sizing: border-box;}body { margin: 0; width: 100%;}.wrapper { padding: 40px 12px; display: flex; justify-content: center;}.chart { height: 400px; width: 500px; background: transparent; display: flex; align-items: flex-end; flex-direction: row; gap: 12px;}.bar { flex: 1; border-radius: 4px 4px 0 0;}The first thing I do in almost all the user interface interview challenges is to use box-sizing: border-box;. It makes width and height calculations predictable by including padding and border in the element's total size, so you don't get unexpected overflow.
I have added a wrapper class which centers the whole bar chart in our application using display: flex and justify-content: center. We have also added some padding to give it some space to breathe.
To make the bars sit side by side and grow from the bottom to top, we are using CSS Flexbox. We set our chart container (the div with className of chart) as a flex container using display: flex;. To fix the bars to the bottom, we use align-items: flex-end; on this flex container, this makes sure all bars are anchored to the bottom. The bars grow upward because we apply height using inline styles, there is a calculation which we run to calculate relative heights of bars which we have already discussed above. We use gap: 12px to add spacing between bars so they don't stick to each other.
One very important thing to note here is our .chart container has a fixed height: 400px. This is necessary because our bars use percentage heights. If the parent container does not have a defined height, percentage heights on children will not work and your bars will not appear on screen. This is a very common mistake candidates make, they set percentage height on bars but forget to give a fixed height to the parent container and then wonder why nothing is showing up.
We give flex: 1 to each individual bar, which makes sure that each bar shares the available horizontal space equally so all bars have the same width. We also add border-radius: 4px 4px 0 0 to give each bar slightly rounded top corners, this small detail makes the chart look much more polished with almost no effort.
Adding Loading and Error States
Our Bar Chart is ready and working, we have successfully built the core of the bar chart. Now, if time is left, I would highly recommend you to handle loading and error state while fetching data. It is simple and does not take much time. It also shows seniority to the interviewer. This is how I would update my App.js to add a status state.
App.js
import React from 'react';import './styles.css';import { getData } from './server/api';import BarChart from './components/BarChart';export default function App() { const [chartData, setChartData] = React.useState([]); // idle | loading | success | error const [status, setStatus] = React.useState('idle'); React.useEffect(() => { setStatus('loading'); getData() .then((data) => { setChartData(data); setStatus('success'); }) .catch(() => { setStatus('error'); }); }, []); return ( <main className="wrapper"> {status === 'loading' && <p>Loading...</p>} {status === 'error' && <p>Something went wrong!</p>} {status === 'success' && ( <BarChart items={chartData} /> )} </main> );}Communicate While You Code
Throughout the interview, it is very important for the candidate to express their thoughts and the important decisions they are making while writing code. Lots of candidates silently code the solution and don't talk much. It is very important for candidates to understand that coding is one part of your job as a software developer, explaining code and reasoning about code are another very important part of your job. The interviewer loves candidates who can talk through their solutions. So, please don't be silent, but don't over express too, talk about the important decisions for example:
- I am thinking of maintaining state here because of so and so reasons
- This is how I am thinking of fetching the data, these are pros and cons
- I would like to create a separate component for BarChart because of so and so reasons
It gives more confidence to the interviewer that you have solid concepts and you can reason well and communicate well.
I have seen a lot of candidates generate solutions from Cursor, Claude etc, but when asked how it is working, they are not able to tell much. In such cases the candidate is usually rejected.
Interviewer Criteria
HTML/CSS
Does my layout accurately match the provided image?
Did you style the UI quickly (10 minutes or less)?
Did I consider using the
namenode from chart data for improving accessbility?Are my CSS class names both self-explanatory and meaningful?
JavaScript
Was I successful in demonstrating my ability to fetch data from a mock API?
Was I able to sort the chart items in both ascending and descending order cleanly?
Do I know how the JavaScript
sortmethod works?Have I leveraged ES6 features efficiently, such as let, const, arrow functions, and destructuring?
Are my variable and function names descriptive, maintaining a consistent naming convention?
How swiftly was I able to develop the logic for identifying the bar with maximum height without significant obstacles or delays?
Was I able to cleanly calculate the height of bars relative to the one with maximum height?
React
Have I used the key prop appropriately on all iterated elements, ensuring efficient and correct re-rendering?
Have I considered handling the
loadinganderrorstate when fetching the data?Did I lift the state appropriately, such as lifting the
modestate to theAppto calculate the sorted chart items?Did I derive the sorted chart items from chart items, instead of creating another state for storing sorted chart items?
Am I comfortable using React hooks?
Am I comfortable and proficient in using function components?
Component Architecture
Did I create separate components for
<BarChart />,<Bar />, and<Controls />?Are the names of my classes, functions, handlers, and components clear and understandable?
Performance
Am I able to discuss how to accommodate many data points without compromising the visual integrity and performance of the chart?
Time Checkpoints
- 10:00 AM
Interview starts 👥
- 10:03 AM
Prompt given by the interviewer
- 10:05 AM
Candidate reads the prompt, asks clarifying questions, and starts coding
- 10:10 AM
Data fetched from mock server and stored in state
- 10:20 AM
Chart rendered
- 10:30 AM
Styling completed
- 10:35 AM
Sorting logic implemented
- 10:50 AM
Support for data of any shape added
- 10:55 AM
Discussion with interviewer
- 11:00 AM
Interview ends ✅